#include "Chart.hpp"
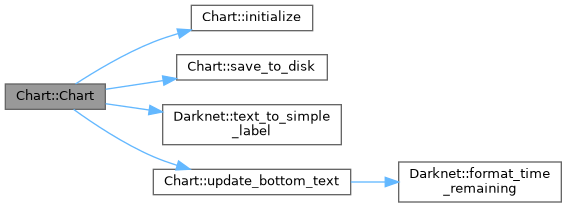
◆ Chart() [1/2]
◆ Chart() [2/2]
| Chart::Chart |
( |
const std::string & |
name, |
|
|
const size_t |
max_batch, |
|
|
const float |
max_loss |
|
) |
| |
◆ ~Chart()
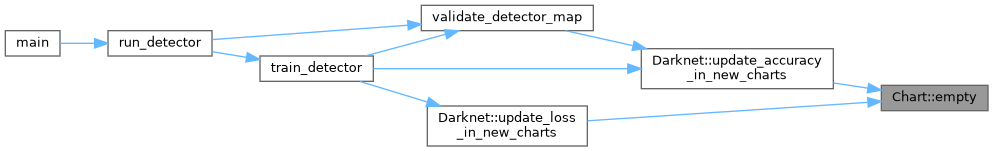
◆ empty()
| bool Chart::empty |
( |
| ) |
const |
Determines if the chart has been initialized.
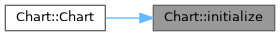
◆ initialize()
| Chart & Chart::initialize |
( |
| ) |
|
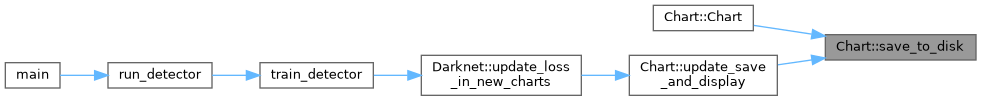
◆ save_to_disk()
| Chart & Chart::save_to_disk |
( |
| ) |
|
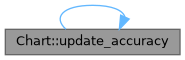
◆ update_accuracy() [1/2]
| Chart & Chart::update_accuracy |
( |
const float |
accuracy | ) |
|
◆ update_accuracy() [2/2]
| Chart & Chart::update_accuracy |
( |
const int |
current_iteration, |
|
|
const float |
accuracy |
|
) |
| |
- Note
- This is called only when a new mAP% value has been calculated, typically every 1000 iterations.
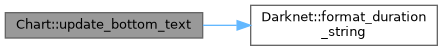
◆ update_bottom_text()
| Chart & Chart::update_bottom_text |
( |
const std::string & |
time_remaining | ) |
|
◆ update_loss()
| Chart & Chart::update_loss |
( |
const int |
current_iteration, |
|
|
const float |
loss |
|
) |
| |
- Note
- This is called at every iteration to update the chart.
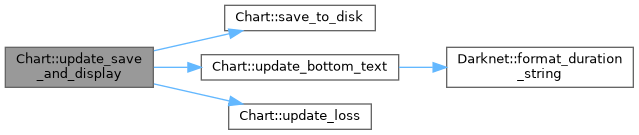
◆ update_save_and_display()
| Chart & Chart::update_save_and_display |
( |
const int |
current_iteration, |
|
|
const float |
loss, |
|
|
const std::string & |
time_remaining, |
|
|
const bool |
dont_show |
|
) |
| |
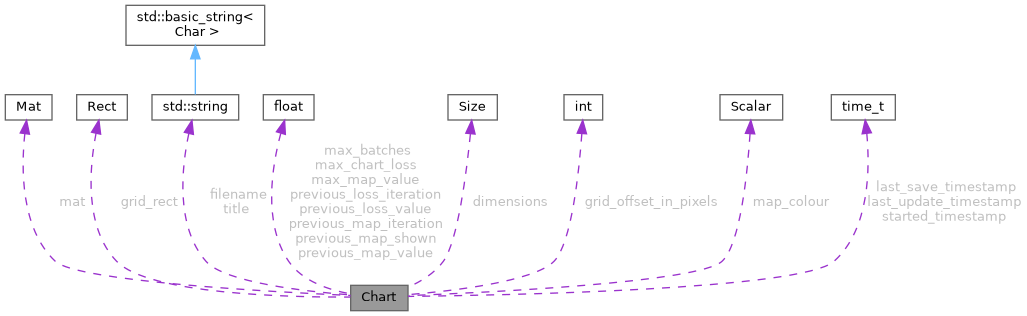
◆ dimensions
| cv::Size Chart::dimensions |
The dimensions of the full chart.png image.
Normally, this would be 1000x940, and once the border areas have been removed from 3 sides this leaves us with a grid measuring 880x880, where each large cell measures 88x88 pixels.
◆ filename
| std::string Chart::filename |
◆ grid_offset_in_pixels
| int Chart::grid_offset_in_pixels |
The number of pixels reserved on the left, right, and bottom sides of the image to draw text. Normally, this is 60.
◆ grid_rect
| cv::Rect Chart::grid_rect |
The RoI for the grid within the full chart mat.
◆ last_save_timestamp
| std::time_t Chart::last_save_timestamp |
◆ last_update_timestamp
| std::time_t Chart::last_update_timestamp |
◆ map_colour
| cv::Scalar Chart::map_colour |
◆ mat
◆ max_batches
We're going to store max_batches as a float to make the math easier.
This way we don't have to keep converting it to a float when we multiply or divide using max_batches.
◆ max_chart_loss
| float Chart::max_chart_loss |
◆ max_map_value
| float Chart::max_map_value |
◆ previous_loss_iteration
| float Chart::previous_loss_iteration |
◆ previous_loss_value
| float Chart::previous_loss_value |
◆ previous_map_iteration
| float Chart::previous_map_iteration |
◆ previous_map_shown
| float Chart::previous_map_shown |
◆ previous_map_value
| float Chart::previous_map_value |
◆ started_timestamp
| std::chrono::high_resolution_clock::time_point Chart::started_timestamp |
◆ title
e.g., "Loss and Mean Average Precision"
The documentation for this class was generated from the following files: